
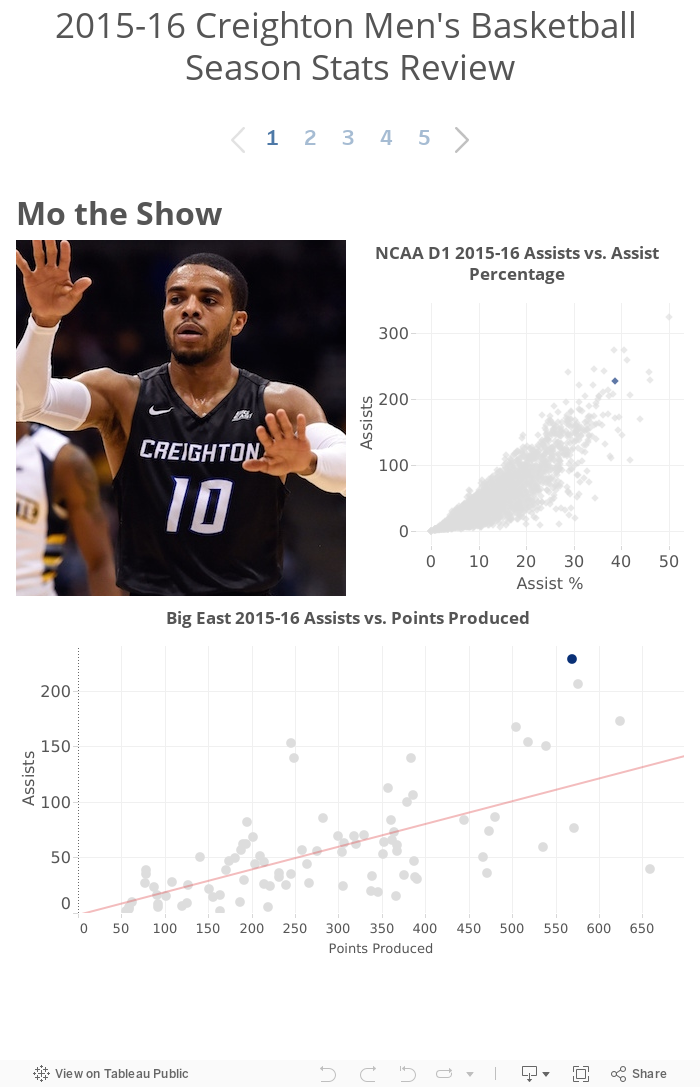
Mo the Show
Earning second team all Big East accolades, Boston U transfer Maurice Watson Jr. quelled any doubts some may have had about his ability to play at a high level in a power conference. He led the Big East in total assists and also tallied a high number of points produced (a statistic that accounts for points produced from a player’s shots, assists, and offensive rebounds). Another impressive feat Mo accomplished last year was owning the #9 overall assist percentage (38.6%) in D1. Assist percentage is an estimate of the percentage of teammate field goals a player assisted while he was on the floor. For Jays fans this shouldn’t be all that surprising — most of the offense seemed to be created by Mo (and statistically, over one-third of it was). This coupled with his 228 assists put him squarely in the elite category of D1 PGs last season.
Geoff’s Giant Year
Senior Geoff Groselle saved his best year for last and ended his Creighton career on a high note. While averaging 11 points and 6 rebounds a game doesn’t make him an All-American, it does represent a level of play that few thought he would be able to reach given the injury ridden parts of his early career. These visualizations highlight how different his senior year was from the rest of his career — his progression can only be described as exponential. Halfway through his senior season Geoff had already matched his total points scored over his previous three years combined (200). If we extrapolate Geoff’s career progression trend to a hypothetical fifth year we could project Doug-esque numbers for him. Of course, that’s not necessarily how statistics work, but still, it’s fun to think about! One thing is for sure: this season Zach Hanson and Justin Patton have big shoes to fill (although they probably have the same sized feet).
A Wide Array of Offensive Contributors
There was quite a bit of speculation as to who would step up for the Jays offensively. After a 2014-15 season that often times lacked essential scoring firepower, both fans and coaches were excited at the prospect of many new faces in the rotation. Would seniors James Milliken and Geoff Groselle take the lead in their final year? Or would transfer Cole Huff lead with his three point shooting talents? Maybe one of the freshmen? Although some had guesses, no one was really certain how last year’s offense would shakedown. What ended up actually occurring was somewhat of a mixed bag. The graph above shows percentage of team points scored per game per player, sorted by season points scored (Mo = #1, Marlon = #13).
Throughout the season the Jays’ leading scorers were consistently inconsistent. Khyri Thomas had big games early in the season and at the end of the season. We saw flashes of brilliance from Cole Huff but nagging injuries limited him. Isaiah Zierden was fairly steady until his third season ending injury prevented him from competing in the NIT. But when injuries hit, others stepped up (including many of the new faces in the program), something that didn’t always happen two years ago.
A Team Led by Juniors
If we group the players in the previous chart by class we get the graph above. Big takeaway from this is that the Junior class (Watson, Huff, Zierden, Hanson, Albert) led the way for most of the season. This obviously bodes well for this coming season as they are all back, with the exception of Albert. The other big takeaway from this graph is the role the senior class played down the final stretch of the season. What is even more impressive is that this senior class was only comprised of two players (Milliken and Groselle) — their leadership will certainly be missed this year.
Ken Pom Rankings
Ken Pomeroy is one of the top minds in college basketball analytics. Kenpom.com, his personal website, hosts a wide array of unique advanced statistics and calculations. It is regarded as a necessary bookmark for fans, journalists, and coaching staffs alike. I cannot recommend enough subscribing to his site for the low low price of $20 a year (really it’s a steal). His rankings are often times more accurate at predicting success in a season and/or NCAA tournament than other measures such as RPI or national polls. The cool part about his data is that it is logged on a game by game level.
I took a look at Creighton’s game-by-game KenPom ranking over Coach Mac’s tenure as head coach to create this visualization. I like to think of the graph as a stock market chart of sorts for the strength of Jays’ program. You can really get a sense of larger program trends: first the slow but steady buildup over Mac’s first four years, then a sharp dropoff after Doug & Co. left, and finally a reloading year that ended with a relatively high ranking compared with the beginning of the season. With many preseason polls having the Jays in the top 20, it’s clear the Jays’ rebuilding phase is just about over.