
Creighton hoops have come a long way in the past 20 years. See: an excerpt from last season’s men’s basketball media guide:
“Creighton has made the postseason in 17 consecutive seasons. The only eight schools to make the postseason in each of the last 17 years are Creighton, Duke, Florida, Gonzaga, Kansas, Kentucky, Michigan State and Syracuse.”
That is elite company. From the NIT berth in 1998 to the 2014 NCAA tournament, the Jays made some sort of postseason tournament every single year. Sure there were the CIT and CBI appearances, but those still count. Unfortunately, all good things must come to an end. The postseason streak finally broke last season, as the Jays’ 14-19 record just wasn’t enough to qualify for any tournament.
After so many years of success it is only natural for fans to begin to have some questions. Was last season a sign of even tougher times to come? Or was it an anomaly? Let’s analyze some recent history.
The graph below depicts the team’s annual wins and losses since the 1995 season. Why 1995? I like to think of the 1995 season, Dana Altman’s first year as coach, as the dawn of the modern era of Creighton basketball. As Piv mentions in this article, the early 90s was a dark time for the program. Dana represented the light at the end of the tunnel.
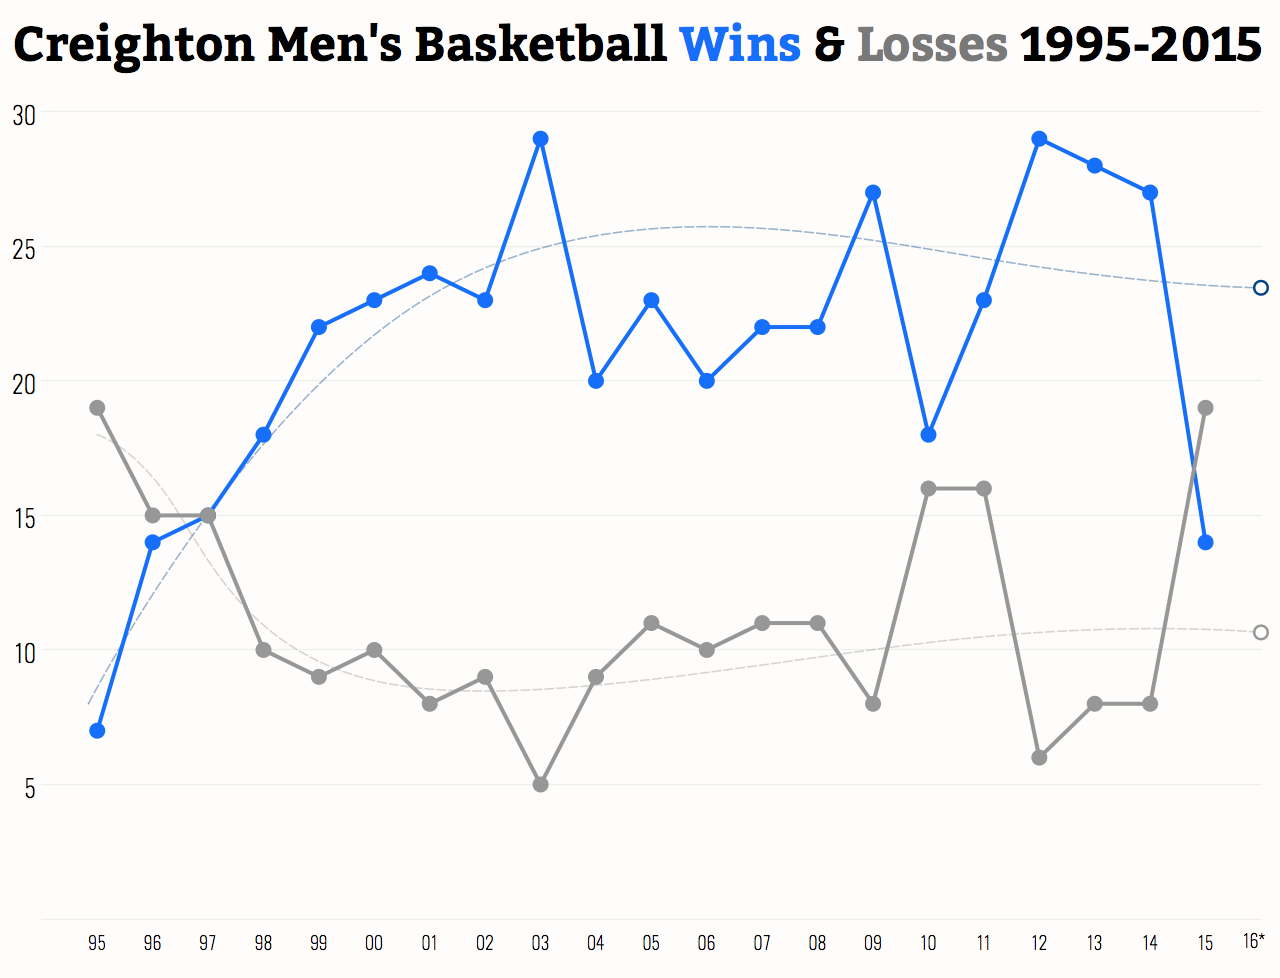
It is important to note that this isn’t a predictive model. With that said, the trend from the past twenty years (indicated by the dashed lines) would suggest this year’s team can expect approximately 23 wins and 11 losses. Will that happen? Hard to say, but the larger point is that last year’s losing season was an anomaly that bucked a long winning trend.
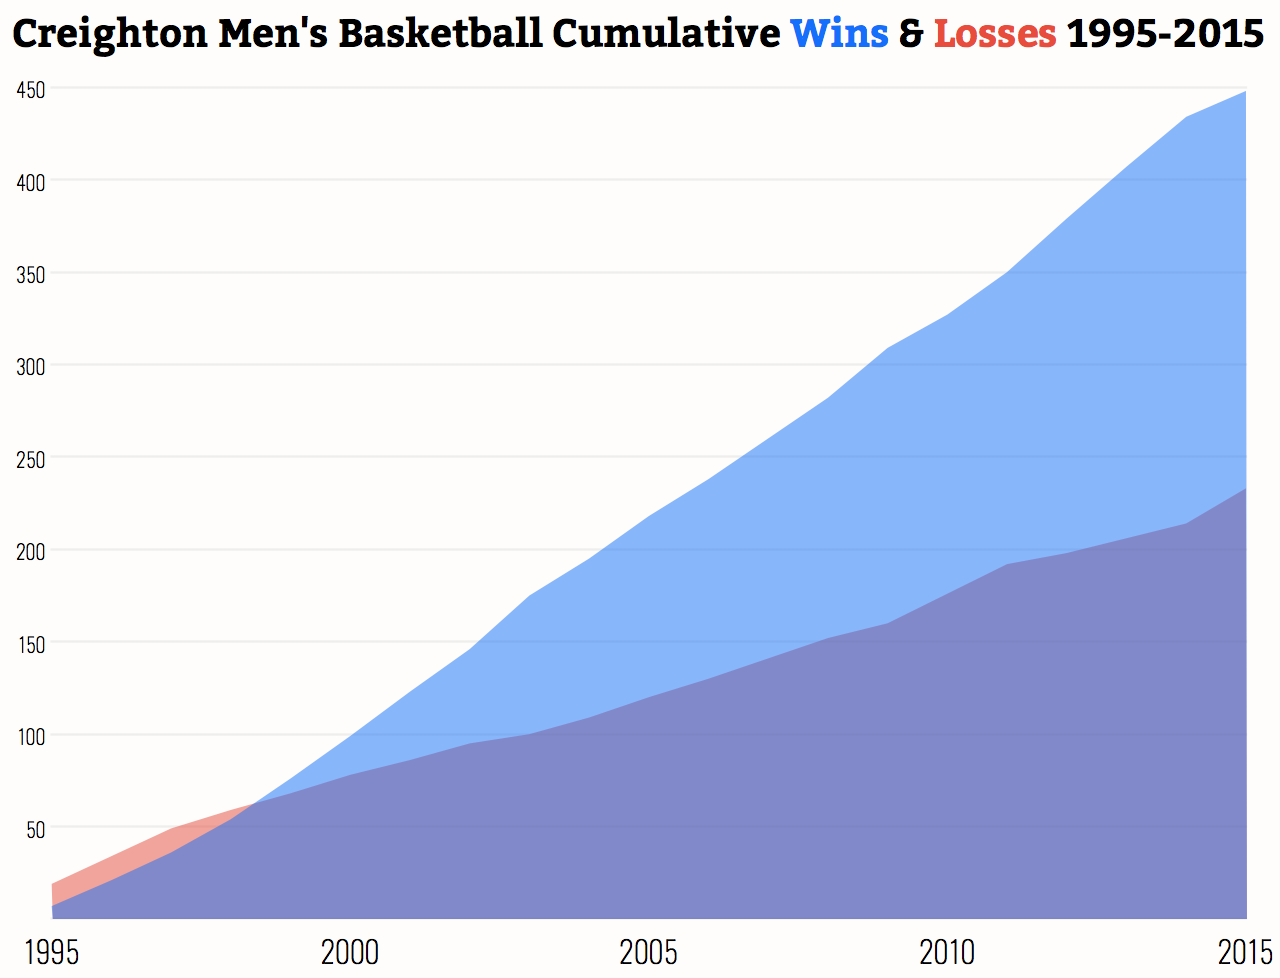
Another way to look at Creighton’s success the past twenty years is to look at their running win total vs. their running loss total. Again things appeared bleak in Dana’s first few years but he soon built a program that consistently reached 20 or more wins every year. That little downtick in the win slope in the 2015 season doesn’t look so bad when compared with the past 20 years now does it?
Ok before we go farther I should probably say that I do in fact realize that we’re not in the Valley anymore and acknowledge that expecting 20 wins a season in the Big East may not be realistic just given our past history. We are in the big leagues now. With that noted I’d like to share some data that may lead to other conclusions.
Enter SRS, or Simple Rating System. SRS is a fairly simple (as the name implies) statistical metric (like KenPom and RPI) to rate a team’s strength. Essentially it represents the average point margin a team would expect playing the average team in college basketball. It is adjusted up or down depending on the strength of schedule.
On this scale, the average team has a rating of zero, winning teams have positive scores, and losing teams have negative scores. The larger the SRS, the better the team. To give an idea of this metric’s range, last season Kentucky held the #1 SRS score of 28.72 while Grambling was dead last at #351 with a score of -30.67. Because SRS accounts for strength of schedule, it gives us a better look at how the program has performed over the past 20 years than just wins and losses.
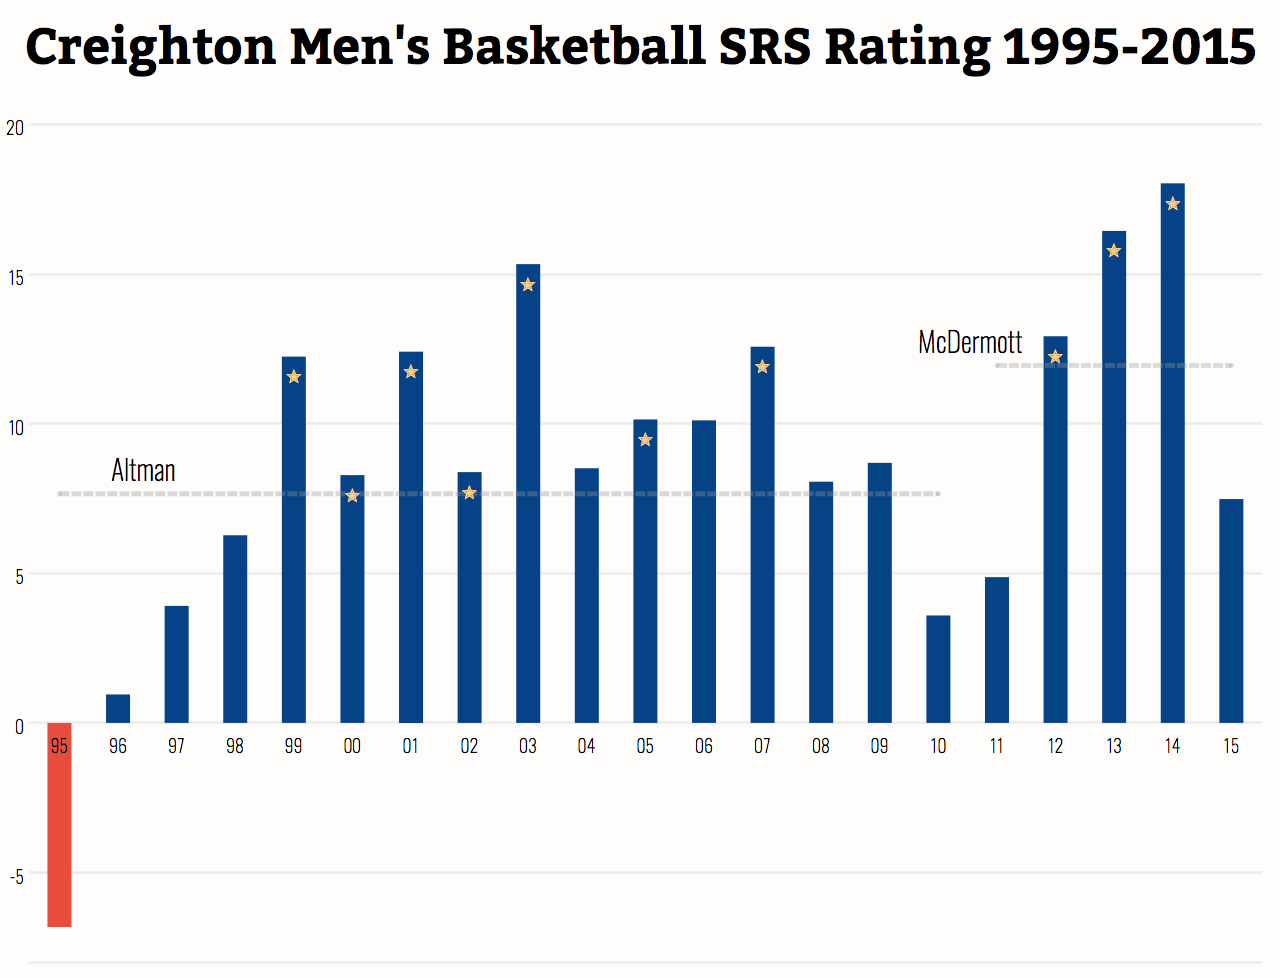
This graph shows a couple things. The bars depict Creighton’s SRS score each year, the gold stars are years the team made the NCAA tournament, and the dashed lines represent the average SRS score per coaching staff — Altman’s teams average 7.67 while McDermott’s average 11.95 (through the 2015 season).
One thing you may be surprised by is the 2015 team’s relatively high SRS score. Although the 2015 team lost as many games as the ‘95 team, its SRS score is substantially higher. Two factors played a role in this rating. First, the Big East is a much tougher conference to play in than the Valley was in the ‘90s (duh). Second, many of Creighton’s losses last season were close games that were decided by a few points. The combination of these factors gave the Jays a favorable SRS score of 7.48, which is just below Altman’s teams’ average score and is actually a better rating than a few years (‘98, ‘10, and ‘11) the Jays made a postseason tournament. Not so bad after all!
Now let’s look at SRS scores in a different way.
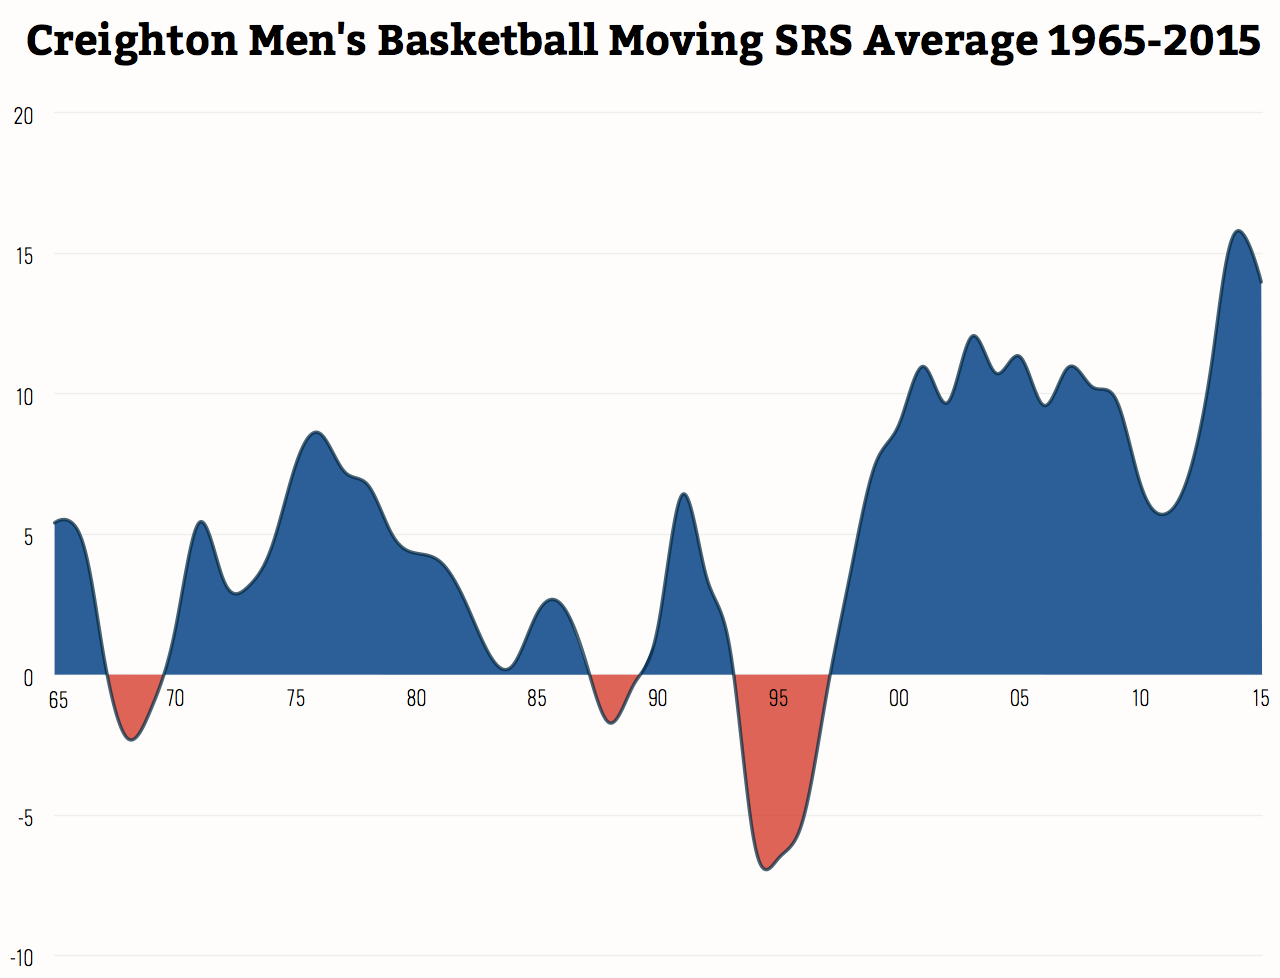
This graph depicts Creighton’s moving average SRS rating over the past 50 years. It takes a season’s SRS rating and averages it with the previous two seasons. In theory this method provides a more complete picture of trends within the program.
The first thing that pops out are the three times in the last 50 years the Jays have been a below average team. And yes the ‘90s was the worst of these times. Very bad. That being said, in the time since the ‘90s, the Jays have been both high performing and fairly consistent (compared with the program’s historical positive to negative fluctuations). Another thing that stands out is the peak at 2014 — the highest point in the program’s history. We all know that the 2014 season of Doug & Co. was a special year, arguably the best in program history. This metric seems to confirm that notion.
That brings us to the 2016 season. Yes, the Jays may still be in recovery mode from the Doug years but they’re still well above average. They are nowhere near crisis mode. With all the new faces this season and a supposed pipeline of talent coming in the next few years, Creighton men’s basketball is in prime position to start another long postseason streak.
[All data from sports-reference.com]