
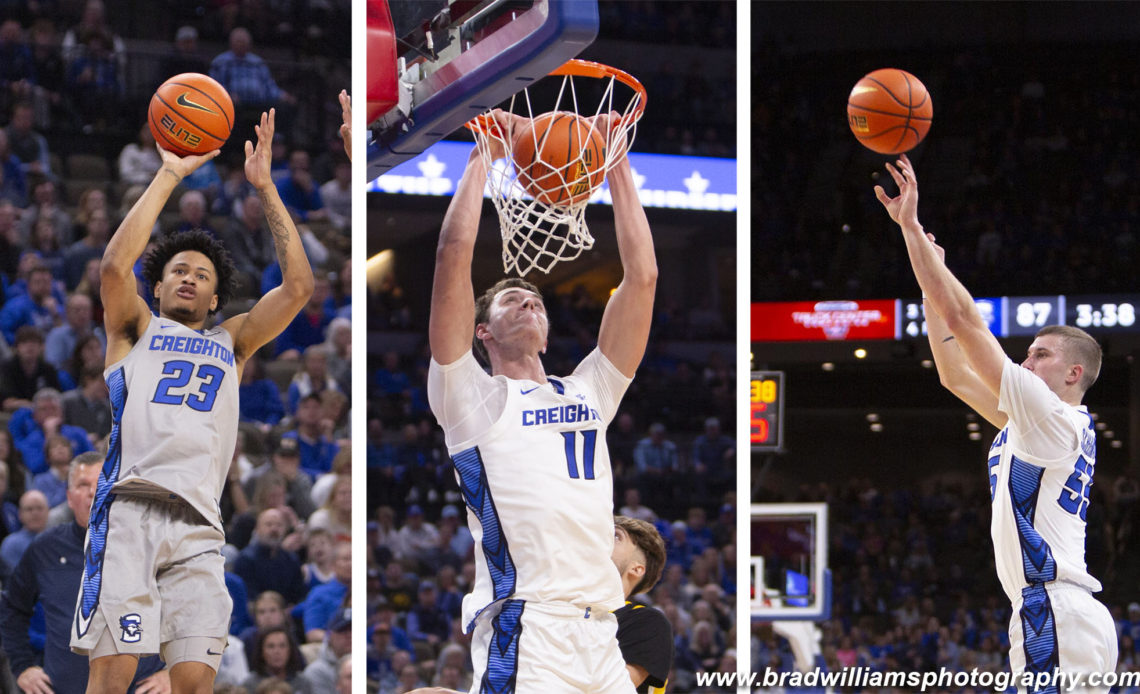
On Monday, Trey Alexander capped a huge week by earning Big East Player of the Week honors. In a win over Xavier, he had a season-high 27 points to go along with nine boards and four assists, and in the win over DePaul, he had 23 points, seven assists and four rebounds.
In their three-overtime win at Seton Hall that immediately preceded those two wins, he had 23 points, eight rebounds, seven assists and one turnover in 53 minutes, and he made not one but two shots to give his team the lead in the final minute of the third overtime. His primary defensive assignment, Kadary Richmond, needed 32 — 32!! — shots to score his 21 points. Thirty-two shots! With Alexander hounding him all afternoon, the All-Big East guard missed 24 shots.
After struggling during the back half of non-conference play and the start of Big East action, Alexander is back to looking like the player everyone expected him to be before the season.
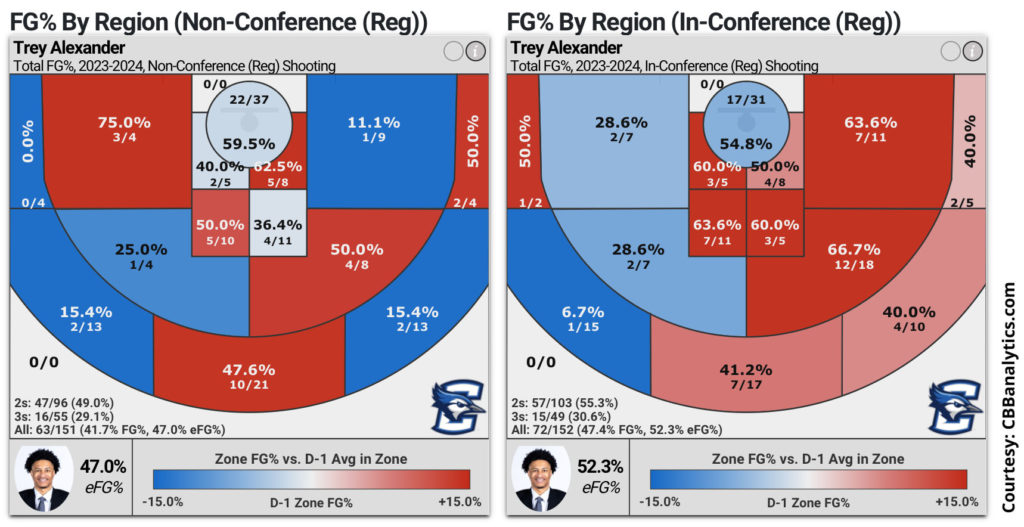
His shooting numbers from the rim (59.5% in the non-conference, 54.8% in the Big East) and from three-point range (29.8% in the non-conference, 28.6% in Big East play) have remained consistent. So where has the improvement come from? He’s become lethal inside the arc.
In non-conference play, Alexander made just 36.0% (9-of-25) on two-point shots outside the paint in 11 games. That number has exploded in Big East play, as he’s shot 53.5% (23-of-43) on those same shots in 10 games.
Similarly, he made 47.1% (16-of-34) on two-pointers in the paint from outside the protected area (4.5 feet out) in non-conference play, a respectable number. But in Big East games, he’s made those shots at a 58.6% clip (17-of-29).
And because Creighton embraces advanced analytics and uses it to help define shot quality, they’ve seen this — and altered the types of shots Alexander takes to emphasize his hot zones. While he took just 16.6% of his total shots from midrange in non-conference, he’s taken 28.3% of his shots from there in Big East games. Meanwhile, his attempts from three-point range and from the rim, the two areas he’s struggled the most from, have dropped. Perhaps not coincidentally, his shooting percentages have grown, he’s scored more points, and his team has been more successful.
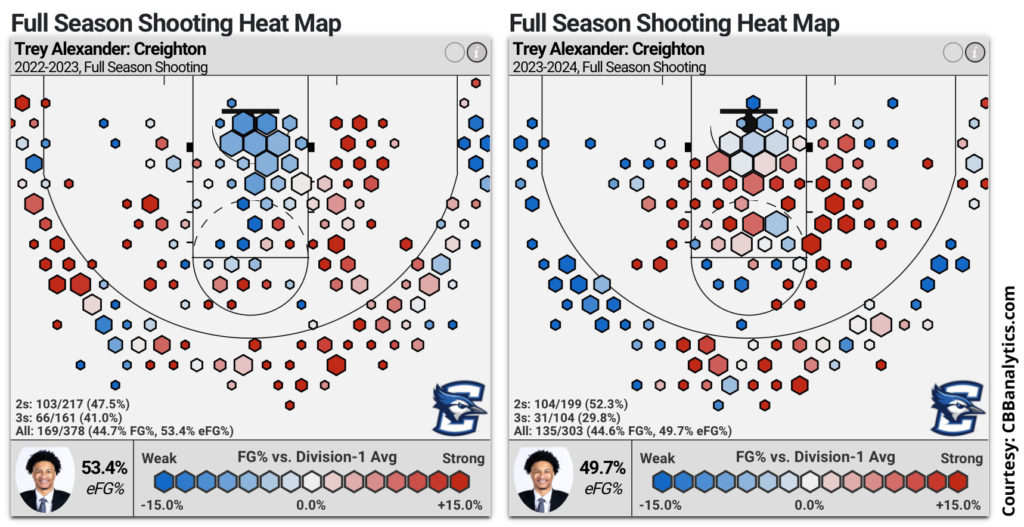
Curious which specific spots on the floor he’s best from? This heat map from CBB Analytics illustrates it — and to no one’s surprise, he’s been damn near automatic from the right elbow, shooting north of 70% from multiple zones to the right of the paint from 14-16 feet out. The comparison to 2022-23 is also interesting as heck, showing his struggles from three-point range — and his vast improvement inside the arc.
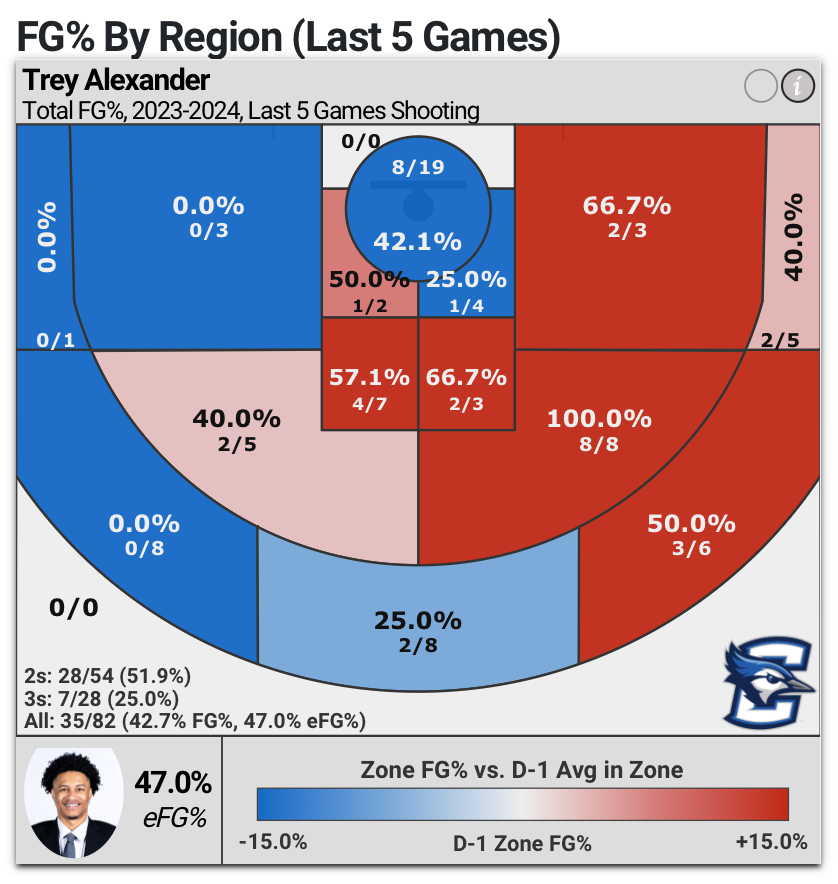
Alexander has generally been a better shooter from the right side of the court versus the left over his career, but it’s been very apparent during the last five games. Look at this split: he’s been damn near automatic, including a perfect 8-of-8 on long twos from the right side, while struggling to make anything from the left. Literally.
Here’s the raw numbers, compared to 2022-23, courtesy of CBB Analytics:
2022-23 (37 games)
All: 169-of-378 (44.7% FG, 53.4% eFG)
Shots at the rim (within 4.5 feet)
18.8% of total shots (71 of 378 total shots)
56.3% shooting percentage (40-of-71)
Shots in the paint (Excluding those at the rim)
13.5% of total shots (51 of 378 total shots)
29.4% shooting percentage (15-of-51)
Mid-range twos (All twos outside the paint)
25.1% of total shots (95 of 378 total shots)
50.5% shooting percentage (48-of-95)
Above-Break Threes
32.5% of total shots (123 of 378 total shots)
43.9% shooting percentage (54-of-123)
2023-24 (21 games)
All: 135-of-303 (44.6% FG, 49.7% eFG)
Shots at the rim (within 4.5 feet)
22.4% of total shots (68 of 303 total shots)
57.4% shooting percentage (39-of-68)
Shots in the paint (Excluding those at the rim)
20.8% of total shots (63 of 303 total shots)
52.4% shooting percentage (33-of-63)
Mid-range twos (All twos outside the paint)
22.4% of total shots (68 of 303 total shots)
47.1% shooting percentage (32-of-68)
Above-Break Threes
29.4% of total shots (89 of 303 total shots)
29.2% shooting percentage (26-of-89)
Corner Threes
5.0% of total shots (15 of 303 total shots)
33.3% shooting percentage (5-of-15)
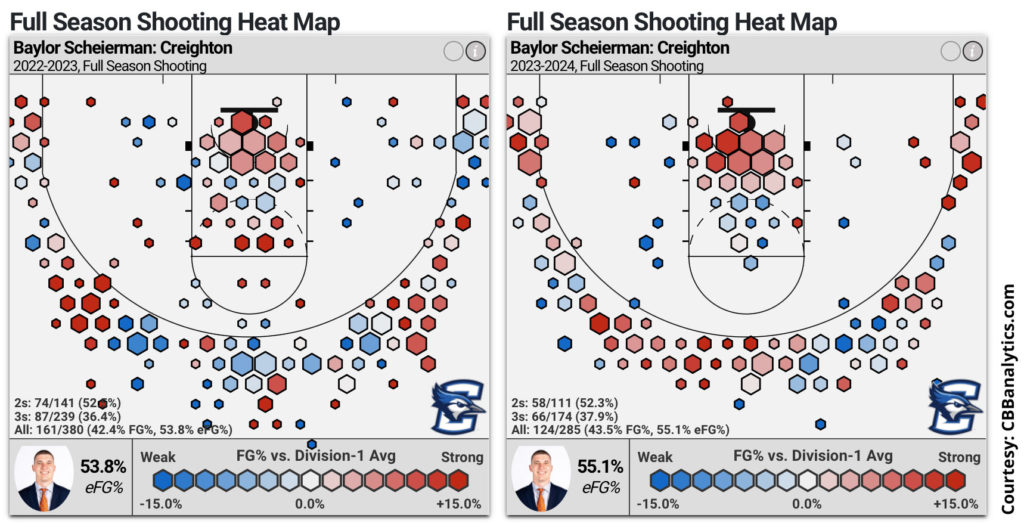
How about Baylor Scheierman, who’s on the watch list for two prestigious awards? This week it was announced he made the top ten list for the Julius Erving Award given to the top small forward in the country, and the top 20 list for the Wooden Award.
He leads the Jays in scoring (17.8 points per game) and rebounding (8.1 rebounds), ranking in third in the Big East in both categories. He also leads the conference in three-pointers per game (3.1) and defensive rebounds per game (7.3). How has he gotten there?
The easy answer is that his offseason strength-training has allowed him to score through contact in the paint, and to get to the rim more often. A year ago, he took 53 shots at the rim in 37 games (making 38-of-53, or 71.7%), and this year he’s taken 49 already in just 21 games (making 39-of-49, or 79.6%). So not only has his shooting percentage gone up by nearly 10 points on those shots, he’s made one more this year in 16 fewer games so far.
He’s also been lethal on corner threes, making 47.8% (22-of-46) of them this year. That’s well above what he’s shooting from three-point range in general (87-of-239, 36.4%), so it’s a shot they’ve put more emphasis on. A year ago, he took the exact same number of attempts from the corner — 46 — in 16 more games.
Here’s his heat map from CBB Analytics, illustrating how deadly he’s been from the corners, as well as his increased focus (and success) at the rim from last year to this year.
As for raw numbers, again courtesy of CBB Analytics:
2022-23 (37 games)
All: 161-of-380 (42.4% FG, 53.8% eFG)
Shots at the rim (within 4.5 feet)
13.9% of total shots (53 of 380 total shots)
71.7% shooting percentage (38-of-53)
Shots in the paint (Excluding those at the rim)
13.7% of total shots (52 of 380 total shots)
44.2% shooting percentage (23-of-52)
Mid-range twos (All twos outside the paint)
9.5% of total shots (36 of 380 total shots)
36.1% shooting percentage (13-of-36)
Above-Break Threes
47.6% of total shots (181 of 380 total shots)
37.0% shooting percentage (67-of-181)
Corner Threes
12.1% of total shots (46 of 380 total shots)
32.6% shooting percentage (15-of-46)
2023-24 (21 games)
All: 124-of-285 (43.5% FG, 55.1% eFG)
Shots at the rim (within 4.5 feet)
17.2% of total shots (49 of 285 total shots)
79.6% shooting percentage (39-of-49)
Shots in the paint (Excluding those at the rim)
14.7% of total shots (42 of 285 total shots)
31.0% shooting percentage (13-of-42)
Mid-range twos (All twos outside the paint)
7.0% of total shots (20 of 285 total shots)
30.0% shooting percentage (6-of-20)
Above-Break Threes
43.9% of total shots (125 of 285 total shots)
34.4% shooting percentage (43-of-125)
Corner Threes
16.1% of total shots (46 of 285 total shots)
47.8% shooting percentage (22-of-46)
Finally, what about Ryan Kalkbrenner? He remains a “cheat code” at the rim, as WBR’s Matt DeMarinis referred to him on a recent Bluejay Beat podcast — he’s made 79.8% on shots at the rim this year (99-of-124) after making 78.1% of them a year ago (164-of-210). But as you can see, even adjusting for games played, his usage there is way down. A year ago, 66.7% of his total shots came at the rim, while this year it’s just 55.9%.
He’s been roughly the same, both in shooting percentage and volume of shots, from the paint and from midrange. The gap is made up at the three point line. A year ago, Kalkbrenner took just 19 threes for the entire season over 34 games, representing 6.0% of his shots (6-of-19, 31.6%). This year, he’s taken 35 of them in 21 games, or 15.8% of his shots (9-of-35, 25.7%).
His heat maps are extremely similar from last year to this year, showing a cluster of areas around the rim where he’s a cheat code — shooting 70% or better from almost everywhere. His usage has risen over the last few games, and if he ends up playing in 34 games this year (equal to last year) he’s on pace for 303 shots inside the arc, or slightly more than a year ago.
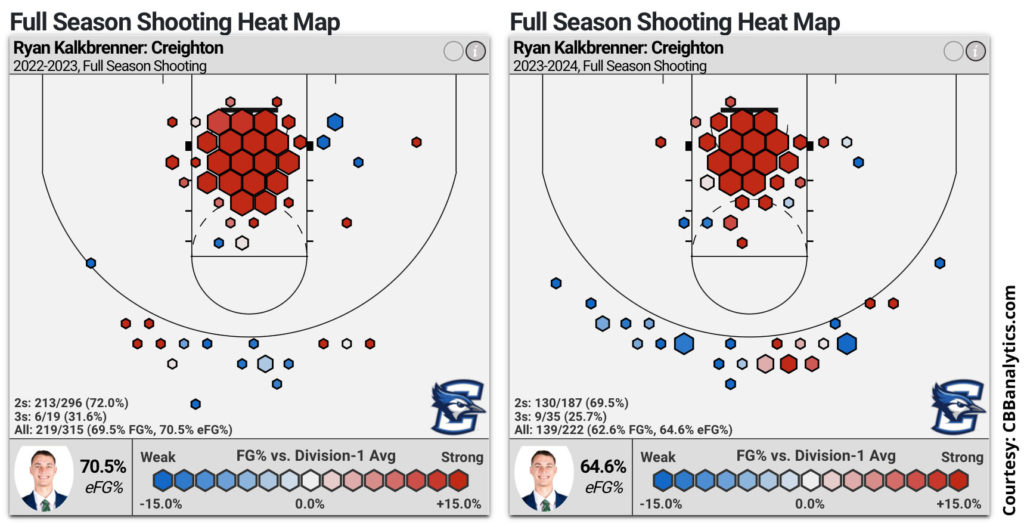
And here’s his raw numbers, courtesy of CBB Analytics. We broke Kalkbrenner’s data down a bit more granularly, since the vast majority of his shots come in the paint — it’s worth looking at exactly where those shots come from.
2022-23 (34 games)
All: 219-of-315 (69.5% FG, 70.5% eFG)
Shots at the rim (within 4.5 feet)
66.7% of total shots (210 of 315 total shots)
78.1% shooting percentage (164-of-210)
Shots in the paint (Left side, 5 feet or closer)
9.2% of total shots (29 of 315 total shots)
65.5% shooting percentage (19-of-29)
Shots in the paint (Left side, 6-10 feet away)
4.8% of total shots (15 of 315 total shots)
40.0% shooting percentage (6-of-15)
Shots in the paint (Right side, 5 feet or closer)
5.1% of total shots (16 of 315 total shots)
68.8% shooting percentage (11-of-16)
Shots in the paint (Right side, 6-10 feet away)
4.4% of total shots (14 of 315 total shots)
64.3% shooting percentage (9-of-14)
2023-24 (21 games)
All: 139-of-222 (62.6% FG, 64.6% eFG)
Shots at the rim (within 4.5 feet)
55.9% of total shots (124 of 222 total shots)
79.8% shooting percentage (99-of-124)
Shots in the paint (Left side, 5 feet or closer)
11.3% of total shots (25 of 222 total shots)
52.0% shooting percentage (13-of-25)
Shots in the paint (Left side, 6-10 feet away)
3.6% of total shots (8 of 222 total shots)
50.0% shooting percentage (4-of-8)
Shots in the paint (Right side, 5 feet or closer)
8.6% of total shots (19 of 222 total shots)
42.1% shooting percentage (8-of-19)
Shots in the paint (Right side, 6-10 feet away)
2.7% of total shots (6 of 222 total shots)
66.7% shooting percentage (4-of-6)